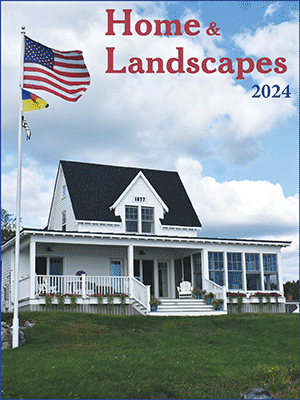
Maine home sales, values up in November
Low for-sale inventory and high demand for Maine’s lifestyle has driven real estate sales and values into double-digit gains. Today, Maine Listings reported that 1,965 single-family existing homes changed hands in November—a rise of 31.17 percent compared to November 2019. Values also increased 20 percent to a median sales price (MSP) of $270,000, comparing November 2020 to November 2019. The MSP indicates that half of the homes were sold for more and half sold for less.
“Residential real estate activity in Maine is vigorous,” says Tom Cole, 2020 President of the Maine Association of Realtors and Broker with Better Homes and Gardens Real Estate The Masiello Group in Brunswick. “In most markets across Maine, Realtors are reporting multiple offer situations on move-in ready listings. The increased competition for historically low for-sale inventory availability is resulting in price appreciation.”
“January through November sales are 7.9 percent ahead of the comparable time period for 2019—Maine’s best year ever. One-third of November’s sales involved out-of-state buyers, compared to one-fourth during November of 2019.”
Nationally, sales of single-family existing homes rose 25.6 percent in November 2020 compared to November 2019. According to The National Association of Realtors, values also increased 15.1 percent to a national MSP of $315,500. The regional Northeast witnessed a sales jump of 25.7 percent, and the regional MSP of $354,100 represents a 17.4 percent increase comparing November 2020 to November 2019.
“Maine’s reputation as a safe place is fueling interest,” says Cole. “With tight market conditions, buyers and sellers should partner with a Realtor for expert counsel around inventory availability, marketing and pricing, and negotiating strategies to successfully achieve their real estate needs and goals.”
Below are two charts showing statistics for Maine and its 16 counties. The first chart lists statistics for the month of November 2019 and 2020 only, statewide. The second chart compares the number of existing, single-family homes sold (units) and volume (MSP) during the rolling quarter of September, October and November of 2019 and 2020.
NOVEMBER ONLY CHART November 1-30, 2019 – November 1-30, 2020
| ||||||
| NUMBER OF UNITS | MEDIAN SALES PRICE | ||||
| 2019 | 2020 | %Change | 2019 | 2020 | %Change |
STATEWIDE | 1498 | 1965 | 31.17% | $225,000 | $270,000 | 20.00% |
| ||||||
ROLLING QUARTER CHART From September 1, 2019 – November 30, 2019 and September 1, 2020 – November 30, 2020
| ||||||
| NUMBER OF UNITS | MEDIAN SALES PRICE | ||||
| 2019 | 2020 | %Change | 2019 | 2020 | %Change |
STATEWIDE | 5209 | 6596 | 26.63% | $225,000 | $275,000 | 22.22% |
|
|
|
|
|
|
|
Androscoggin | 348 | 391 | 12.36% | $181,037 | $215,500 | 19.04% |
Aroostook | 181 | 279 | 54.14% | $95,000 | $112,500 | 18.42% |
Cumberland | 1092 | 1333 | 22.07% | $330,000 | $385,000 | 16.67% |
Franklin | 162 | 210 | 29.63% | $151,250 | $206,950 | 36.83% |
Hancock | 254 | 428 | 68.50% | $223,000 | $305,000 | 36.77% |
Kennebec | 487 | 514 | 5.54% | $174,900 | $210,800 | 20.53% |
Knox | 176 | 264 | 50.00% | $252,000 | $292,500 | 16.07% |
Lincoln | 177 | 255 | 44.07% | $225,000 | $360,000 | 60.00% |
Oxford | 267 | 343 | 28.46% | $170,000 | $229,000 | 34.71% |
Penobscot | 532 | 579 | 8.83% | $150,700 | $179,100 | 18.85% |
Piscataquis | 101 | 161 | 59.41% | $129,900 | $125,900 | -3.08% |
Sagadahoc | 130 | 163 | 25.38% | $250,000 | $291,000 | 16.40% |
Somerset | 179 | 249 | 39.11% | $135,000 | $149,900 | 11.04% |
Waldo | 154 | 226 | 46.75% | $197,000 | $262,000 | 32.99% |
Washington | 117 | 211 | 80.34% | $120,000 | $168,000 | 40.00% |
York | 852 | 990 | 16.20% | $300,000 | $368,000 | 22.67% |
Event Date
Address
United States


